Introduction TDI MetaTrader indicator
This is the Traders Dynamic Index (TDI), a very common MetaTrader indicator-a place with an all-rounded tool for traders to analyze both the market trend, momentum, and volatility. It’s crafted in a manner that multiple indicators are put on one chart. This allows traders to make judgments clearer and more precise. What exactly is TDI, how does it work, and what are its advantages? How can you use it to your best trading potential?
What Is the Traders Dynamic Index (TDI)?
TDI is a comprehensive indicator that integrates various elements:
- The Relative Strength Index measures the rate of change of market momentum and determines when a market is overbought or oversold.
- Moving Averages (MA): It smooths the price data and displays the trends over the period.
- Volatility Bands (Bollinger Bands): An indicator that indicates market volatility and where the probability of a breakout and reversal would most likely be.
By combining these tools, TDI provides traders with an enhanced visual representation of market conditions, simplifying analysis and supporting strategic decision-making.
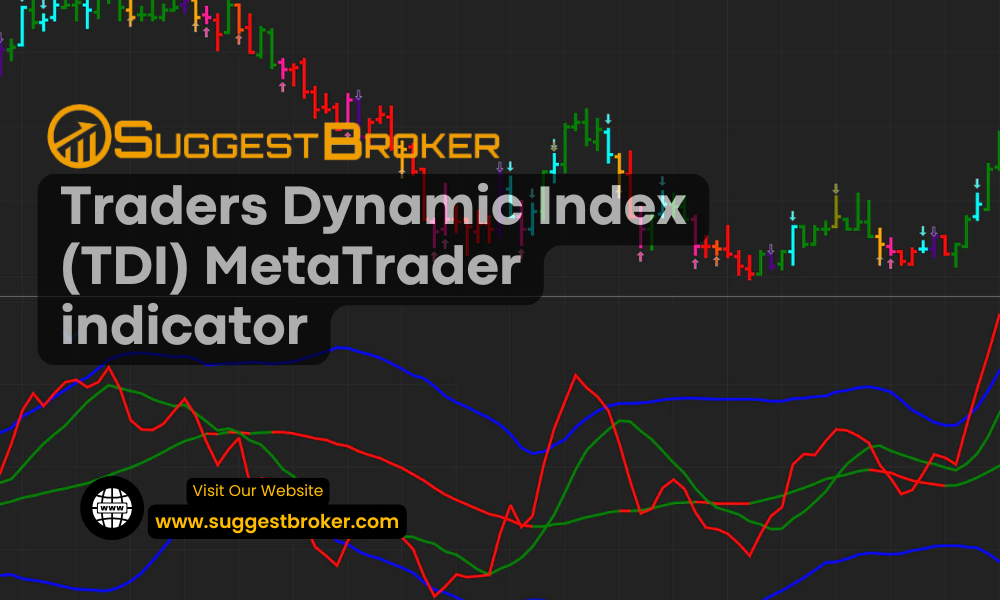
Key Components of the TDI Indicator
- RSILine (Green): It is a sign of market momentum and indicates in which direction the price is moving.
- The red color is used for a signal line, which is a moving average of the RSI line and, hence, a trigger for potential buy or sell signals.
- Volatility Bands (Blue): A variation of Bollinger Bands, where one sees volatility in the market.
- Market Base Line Yellow: This is helpful in finding out the overall trend and which direction to enter or exit.
Benefits of Using the TDI Indicator
Thorough Market Analysis:
- Merges all the momentum, trend, and volatility indicators into one chart.
- Need not rely on various indicators; simplifies your trading interface.
Versatile Application
- It can be applied in different styles of trading – scalping, day trading, swing trading, and everything else in between.
Straightforward Signals
- Cross-over buy and sell signals off the RSI line against the signal line.
- Better Decision
- It can define high-probability trade setups and possible reversals.
How to Use TDI in Your Trading Strategy
TDI can be used in various ways depending on your trading strategy. Here’s a step-by-step guide for beginners:
- Identifying Buy and Sell Signals
- Buy Signal: This occurs when the green RSI line crosses above the red signal line. The conditions it occurs under are particularly convincing when the crossover happens below the market base line, meaning the security is in an uptrend.
- Sell Signal: When the green RSI line crosses below the red signal line. And in case of a crossing above the market base line, this may mark an entry in an impending downtrend.
- Using Volatility Bands for Confirmation
- This is strong market momentum since the price has moved outside its volatility bands. For example, a breakout from the upper band could present the possibility that there is still room to move up and down, while the movement below the lower band may indicate that it will continue to move down.
- Analyzing the Market BaseLine
- The baseline in the market is helpful in determining the overall bullish or bearish orientation of the market. Typically, when the RSI and the signal lines lie above the baseline, the trend is going to be bullish. When the former are positioned below the latter, the trend is going to be bearish.
Advantages of Trading with TDI
- Comes with the Integration of Multiple Indicators: Saves time and effort as it integrates trend, momentum, and volatility analysis within one.
- This removes multiple charts containing RSI, moving averages, and Bollinger Bands all over a single chart for better readability.
- It should ideally give reliable signals, and in the case of a TDI, crossover signals help identify clear buy and sell opportunities with greater accuracy.
Practical Tips for Using the TDI Indicator
- Avoid Overtrading: Use TDI with other technical indicators rather than relying on TDI alone to make decisions.
- Time Frame Matters: TDI can be used on any of the time frames, but it is best applied in relation to the strategy that you are using in making your trades: longer time frames usually for swing trading and shorter time frames for scalping.
- Practice with a Demo Account: Before applying TDI to your live trading, practice using this indicator on a demo account to learn how the indicator acts in different market conditions.
Conclusion
The Traders Dynamic Index meta-indicator is handy when all-in-one analytical use for market trends, momentum, and volatility is required. TDI amalgamates elements like RSI, moving averages, and Bollinger Bands into simplifying complex chart analysis and promotes better decision-making. Both novice and experienced traders who use TDI will surely find its application helpful for catching high-probability trades. This is something you can actually start today by using TDI on a demo account and gradually integrating it into your live trading. Happy trading!
Read More Article : How to Open a Forex Trading Account for Beginners
FAQs
What is the main application of the Traders Dynamic Index?
TDI facilitates better market momentum, trend, and volatility analysis within one chart, thus making decision-making easier.
Is the TDI indicator customisable in MetaTrader?
It is customizable with different settings: RSI period, MA type, and colors.
Is TDI only a trading tool for forex?
No, although it is heavily used in Forex, the TDI can be traded on any asset including stock, commodities, and indices.
Is the TDI indicator supported by MT4 and MT5?
Yes, the TDI indicator is offered with MetaTrader 4 (MT4) as well as with MetaTrader 5 (MT5).
What are the most frequently applied strategies in trading with the TDI indicator?
Usually, the trader uses a crossing signal of the RSI and lines of the signal as well as volatility bands analyses.
Are there any disadvantages in the use of the TDI indicator?
The TDI sometimes plots the false signals in periods of low volatility. Therefore, you need to add some other indicators to it.
Could the beginner successfully use the TDI indicator?
Actually, because of the clear visual signal, it is easy to use for the novice, although mastering its components through experience is always desirable.
How to minimize phony signals of the TDI?
Use the TDI in conjunction with others like support and resistance levels to verify signals and time frames higher than it for greater accuracy.
What time-frames will work well with the TDI indicator?
The TDI can be used on any time frame but the more effective the better your trading style is (swing trading, longer term time-frames).
Can you use this indicator to automate your trades?
Yes. It can be coded into automated trading systems also known as EAs in MetaTrader using MQL4 or MQL5.